
How can we check for efficiency problems in a solution like ElasticSearch?
- February 27 2025
- In this article, you will learn:
- Setting up the ES cluster in the developement environment to test its efficiency
- Integration of the developing cluster under Prometheus and its visualtion on Grafan.
- Efficiency tests on the production environment
- Analysis of the ES cluster in the production environment
- Indexing interval
- Garbage Collector
- Configuration of additional nodes in the cluster
- Proposition of other solutions to increase efficiency
- FAQ
- Let's have a chat!
In this article, you will learn:
- how to approach the analysis of performance issues in an Elasticsearch cluster,
- why it is worth recreating the production environment in a development environment,
- how to use Prometheus and Grafana to monitor system load and query execution time,
- what additional actions can improve query performance and system stability.
The present analysis aims at finding a solution to the problems caused by the long time taken to process SQL queries, especially during moments of the day when the system is more loaded. One of the main goal was to improve the efficiency during peak hours when the system experiences bigger loads. In order to conduct this research, 7 different methods where used to analyze the long processing of queries.
Used methods to analyze performance problems within ElasticSearch.
Setting up the ES cluster in the developement environment to test its efficiency
Setting up the ElasticSearch cluster in the developement environment, conformly to the parameters and number of nodes present in the operational environment.
The goal is to test data base loading and query execution time by recreating the same conditions. This is a possible approach in situations where you possess the necessary ressources but you still cannot recreate the problems in the current test environment.
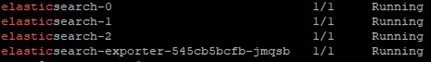
The 3-nodes cluster ElasticSearch is here set up in the developement environment.
It is also recomended to implement the Kibana tool for a better access to data visualisation and programming tools. In order to recreate the problems occuring in the production environment it is worth proceeding to a data base production migration – with the possibility of anonimizing data. When dealing with big data bases, it’s best to separate it in multiple steps and the indexes into parts.
Integration of the developing cluster under Prometheus and its visualtion on Grafan.
It’s good to integrate the programing cluster with the Prometheus software in order to get a data visualization on Grafan. We start our efficiency tests on the developing environment, starting with the analysis of the queries that are causing us trouble during peak hours.
With this method, you can collect all the activity information within a specific time frame. The statistics collected from the processing of trouble-causing tasks, that can be visualized in Grafan, may not necessarily reflect the problems occuring in the production environment. Even integrating simultaneously all the tasks. In a situation like this one, it is necessary to conduct more tests.
Efficiency tests on the production environment
The tests need to start with time frame where troubles were occuring the most.
In order to simulate an increased number of queries, you can process queries using parsea and place them in automatic system scripts (f.e. through the use of bash scripts).Then you should place them in the ES base with help of curl tools.
Analysis of the ES cluster in the production environment
We can continue our analysis of the ES cluster by starting with some key elements that influence on our efficiency:
- checking what ressources are consumed by each cluster node during peak periods,
- checking the Java configuration,
- analysis of the logs direclty for each node,
- checking if shards are equally spread on the nodes, because proper repartition of the shards allows an optimal cluster functionning,
- checking the number of ThreadPool on each node at a given time, since an even load repartition on all the nodes is key for an efficient cluster.
The repartition of shards can be checked through:
Exemple of a result:
Indexing interval
In order to better the data base efficiency it is also necessary to change the parametre responsible for refreshing indexes. In this example, we changed the index refresh interval in dynamic mode (without restarting the cluster) from 1s to 30s, as below:

As a result of the change we obtained better indexing intervals.
However, in this case, it did not translate into an improvement in the time of query execution.
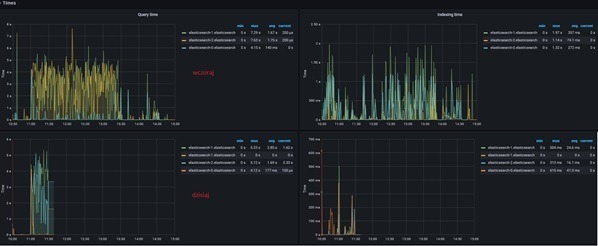
Exemple of statistics on Grafan after implementing the indexing change.
Garbage Collector
The next element that can improve the efficiency of the ES cluster is changing the GC parameters.
The Garbage Collector module automatically detects when an object isn’t usefull anymore and deletes it, freeing up space for objects that are still used in the process.
With the Garbage Collector tool you can:
- add storage ressources,
- increase the ES_JAVA_OPTS value.
You can expect fewer GC launches over a given period of time.
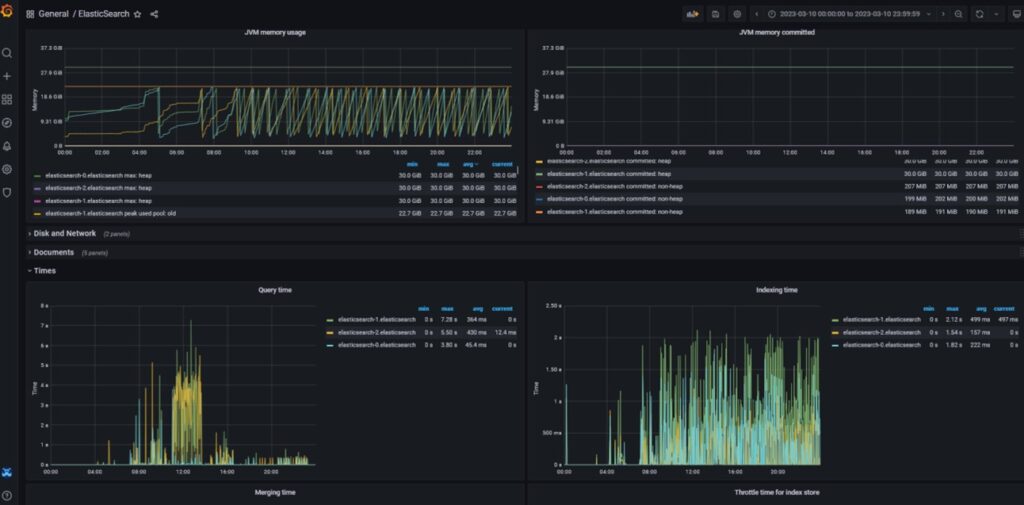
GC Statistics and Query Time on Grafam after implementing changes.
Configuration of additional nodes in the cluster
The next element that can improve the efficiency of the ES cluster is the addition of new nodes.
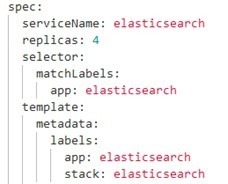
Adding another node to the cluster improves the overall efficiency through the use of the additional ressources that will relieve the other nodes. The configuration is made by changing the number of replicas. Shards are spread evenly, and the additional node will automatically start to process data.
The setup is made by changing the amount of replicas in the elasticsearch.yaml, as below:
Proposition of other solutions to increase efficiency
Other possible solutions that you can implement after adding another node:
- Indentify the indexes where most problems occur and increase the number of replicas on those indexes.
- Increase the number of shards for each indexes. We can then apply Split Index API or Reindex API mechanisms. Indexes during that time need to go in a read-only state, which needs to be properly planned.
FAQ
Long query execution times may result from high cluster load, uneven shard distribution, insufficient memory resources, non-optimized JVM configuration, frequent Garbage Collector runs or intensive data indexing. That is why performance analysis should cover both the queries themselves and the configuration of the entire environment.
Recreating an Elasticsearch cluster in a development environment makes it possible to safely run performance tests without affecting the production environment. This allows teams to check how the system responds to specific queries, increased load and configuration changes before implementing them in production.
Prometheus enables the collection of metrics from the Elasticsearch cluster, while Grafana allows these metrics to be visualized in clear charts and dashboards. As a result, administrators can monitor query response times, resource usage, the number of Garbage Collector runs and the load on individual cluster nodes.
Changing the index.refresh_interval parameter may improve indexing performance because indexes are refreshed less frequently and the cluster uses fewer resources for this process. However, this does not always directly translate into shorter query execution times, so after each change, measurements should be taken and the results compared.
Adding another node is worth considering when the existing nodes are constantly overloaded, queries take too long to execute and the available resources are not sufficient to handle the traffic. A new node can help distribute the load, increase cluster performance and improve overall system stability.

As Vice President of Core Logic, Konrad is responsible for developing technology solutions that support the business growth of clients. He has over 20 years of experience in the IT industry, including leading ambitious projects focused on building, scaling, and securing IT infrastructure. He specializes in DevOps, microservices, and cloud solutions. Konrad combines a technological perspective with a business-oriented approach, enabling him to translate complex organizational needs into stable, secure, and efficient systems.
Let's have a chat!
Are you ready to start your digital journey? Fill in this form or contact us directly by phone.